Background
A prediction model does two things: it ranks players, and it assigns probability estimates to outcomes. Most evaluation focuses on ranking — did the model's top pick do better than its 10th pick? That question matters, but it misses something important.
Probability estimates carry implicit claims. When DataGolf says a player has a 15% chance of finishing top-10, it is saying: in situations like this, players like this finish top-10 about 15% of the time. If that claim is right, the model is calibrated. If the model says 15% but the player actually hits the outcome 22% of the time, something is systematically off — and decisions made using those probabilities (lineup construction, pick-em contests, model stacking) inherit that error.
Calibration and ranking are different properties. A model can rank players correctly while its probability estimates are badly miscalibrated. And a model can have well-calibrated probabilities while occasionally ranking players wrong. This study addresses only calibration. Ranking accuracy is a separate question.
The obvious hypothesis going in: the model is overconfident about favorites. High-ranked players tend to be in strong form, which probably inflates their predictions beyond what their actual conversion rate supports. Most sports prediction models err in this direction.
The data told a different story.
Data and Methodology
/preds/pre-tournament-archive · 292 PGA Tour events, 2020–2026 · 36,656 player-event records (baseline model)
The archive endpoint returns, for each player in each event field, the model's pre-tournament probability estimates across several outcome markets: win, top-3, top-5, top-10, top-20, top-30, make cut, first-round leader. We focus primarily on top-10 as the best-powered outcome — frequent enough to build large sample sizes in each probability band, rare enough to be meaningful.
Two model variants are compared: baseline (rolling strokes-gained skill ratings) and baseline_history_fit (adds course-specific historical performance). Finding 5 reports the comparison.
Method: Calibration curve analysis.
- Bin all player-event observations by predicted top-10 probability into seven bands: 0–5%, 5–10%, 10–15%, 15–20%, 20–25%, 25–30%, 30%+.
- Within each band, measure the fraction of players who actually finished top-10.
- Compare predicted (x-axis) to actual (y-axis). The diagonal represents perfect calibration.
Statistical significance is assessed using 95% confidence intervals under the normal approximation to the binomial: rate ± 1.96 × √(rate × (1 − rate) / n). All gaps reported as significant exceed their confidence interval.
Finding 1 The Model Is Well-Calibrated Overall
The Expected Calibration Error (ECE) for the baseline model is 1.1%. For the history-fit model, it is 1.2%. ECE measures the weighted average absolute gap between predicted probability and actual rate, across all bins.
An ECE of 1.1% means that on average, across the probability spectrum, predictions are off by about one percentage point. In the context of sports prediction — where outcomes are noisy, fields change week-to-week, and players have both hot streaks and injuries — this is a strong result.
Read the Full Study
Five findings, the calibration table, year-over-year Brier trends, and the course history result. Free — just your email.
Joins the free Divot Lab newsletter. Unsubscribe anytime.
You're in — scrolling down now.
Finding 1 The Model Is Well-Calibrated Overall
Baseline model
History-fit model
= Actual win rate
ECE measures the weighted average absolute gap between predicted probability and actual rate, across all bins. An ECE of 1.1% means that on average, across the probability spectrum, predictions are off by about one percentage point. In the context of sports prediction — where outcomes are noisy, fields change week-to-week, and players have both hot streaks and injuries — this is a strong result.
Win probability calibration is essentially perfect at the aggregate level: mean predicted win probability is 0.8% and actual win rate is 0.8%. These numbers establish a baseline: DataGolf is not producing poorly-constructed probability estimates. The model reflects real information.
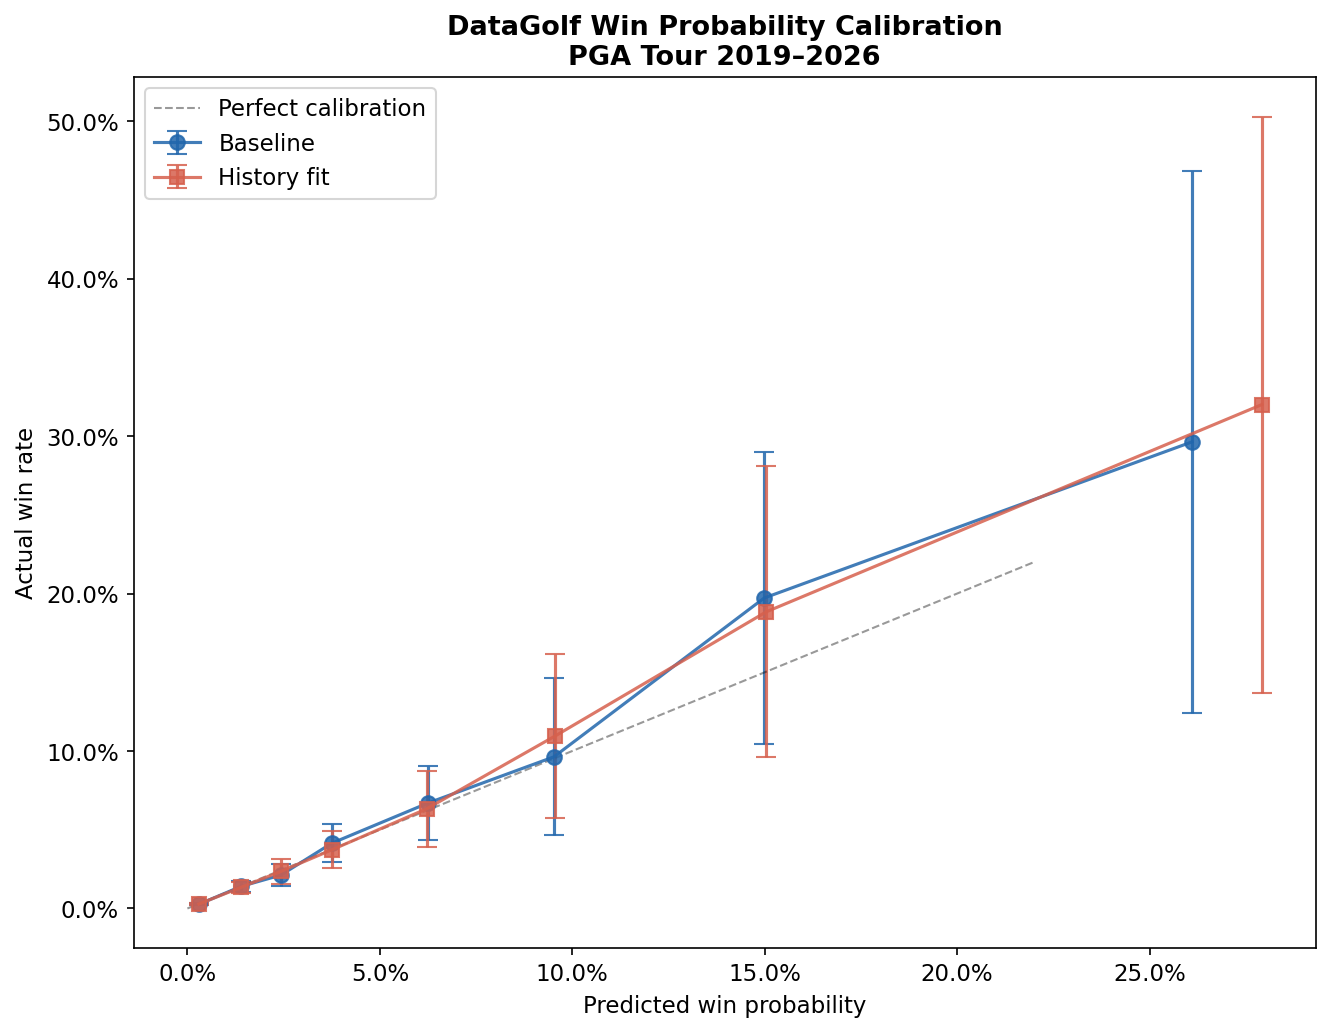
Finding 2 The Model Is Systematically Underconfident
Here is where the hypothesis breaks down.
Every probability band shows the same pattern: actual top-10 rates exceed predicted rates. The model does not overestimate — it underestimates at every level of the probability scale.
| Predicted band | Mean predicted | Actual rate | Gap | Significant? |
|---|---|---|---|---|
| 0–5% | 2.3% | 2.7% | +0.5 ppts | Yes |
| 5–10% | 7.2% | 8.3% | +1.1 ppts | Yes |
| 10–15% | 12.2% | 13.8% | +1.6 ppts | Yes |
| 15–20% | 17.2% | 20.0% | +2.8 ppts | Yes |
| 20–25% | 22.2% | 25.0% | +2.9 ppts | Yes |
| 25–30% | 27.2% | 27.8% | +0.7 ppts | No |
| 30%+ | 41.5% | 46.8% | +5.3 ppts | Yes |
Six of seven bins are statistically significant. The 25–30% bin falls within its confidence interval and cannot be distinguished from perfect calibration, but it still points in the same direction.
The gap is not random noise. It is a consistent directional bias. The model is conservative.
Finding 3 The Gap Grows for Elite Players
The underconfidence is not uniform. The gap starts small at the low end (0.5 percentage points for the 0–5% bin, n=16,744) and widens at higher probabilities, reaching its peak in the 30%+ band.
Players assigned a 30%+ top-10 probability — roughly the top 1–3 players in any given field — finished top-10 at a 46.8% rate against a mean predicted probability of 41.5%. The gap is 5.3 percentage points, with a 95% confidence interval of ±3.2 percentage points. It is statistically significant with 931 observations.
What this means practically: DataGolf's model is most wrong about its most confident predictions. When it says a player is a near-lock to contend, the player performs even better than that.
One plausible explanation: the players who attract 30%+ top-10 predictions tend to be at the peak of both their career skill and their current form. The rolling strokes-gained model captures career skill well. Current form may be underweighted, and form is correlated with elite-tier predictions — a player in the form of his life is both more likely to receive a high prediction and more likely to outperform his baseline skill.
Finding 4 The Model Improved Through 2023, Then Reversed
Brier score measures mean squared prediction error — lower is better. Tracking it by year shows whether the model is improving over time.
| Year | Events | Brier Score (top-10) |
|---|---|---|
| 2020 | 37 | 0.0755 |
| 2021 | 47 | 0.0743 |
| 2022 | 46 | 0.0722 |
| 2023 | 45 | 0.0706 |
| 2024 | 49 | 0.0758 |
| 2025 | 47 | 0.0745 |
| 2026* | 21 | 0.0818 |
*Incomplete season — noisier estimate.
From 2020 to 2023, Brier score improved steadily and meaningfully: −0.0049 over four years. This is a real improvement, not sampling noise. Then 2024 jumps sharply back to near the 2020 level (+0.0052 from 2023 to 2024) and remains elevated through 2025.
The most likely explanation is structural disruption to the PGA Tour, not model degradation. Between 2022 and 2024, LIV Golf attracted a significant number of the tour's most predictable top-tier players — those with long track records of consistent strokes-gained performance that the model could reliably extrapolate. With those players gone, the remaining field is more volatile, and the model's implicit assumptions about player consistency became less reliable.
The elevated events schedule introduced in 2024 may also be a factor. Signature events draw smaller, star-heavy fields; other events draw weaker, thinner fields. Predicting a 78-player Signature Event is a structurally different problem than predicting a 132-player standard event.
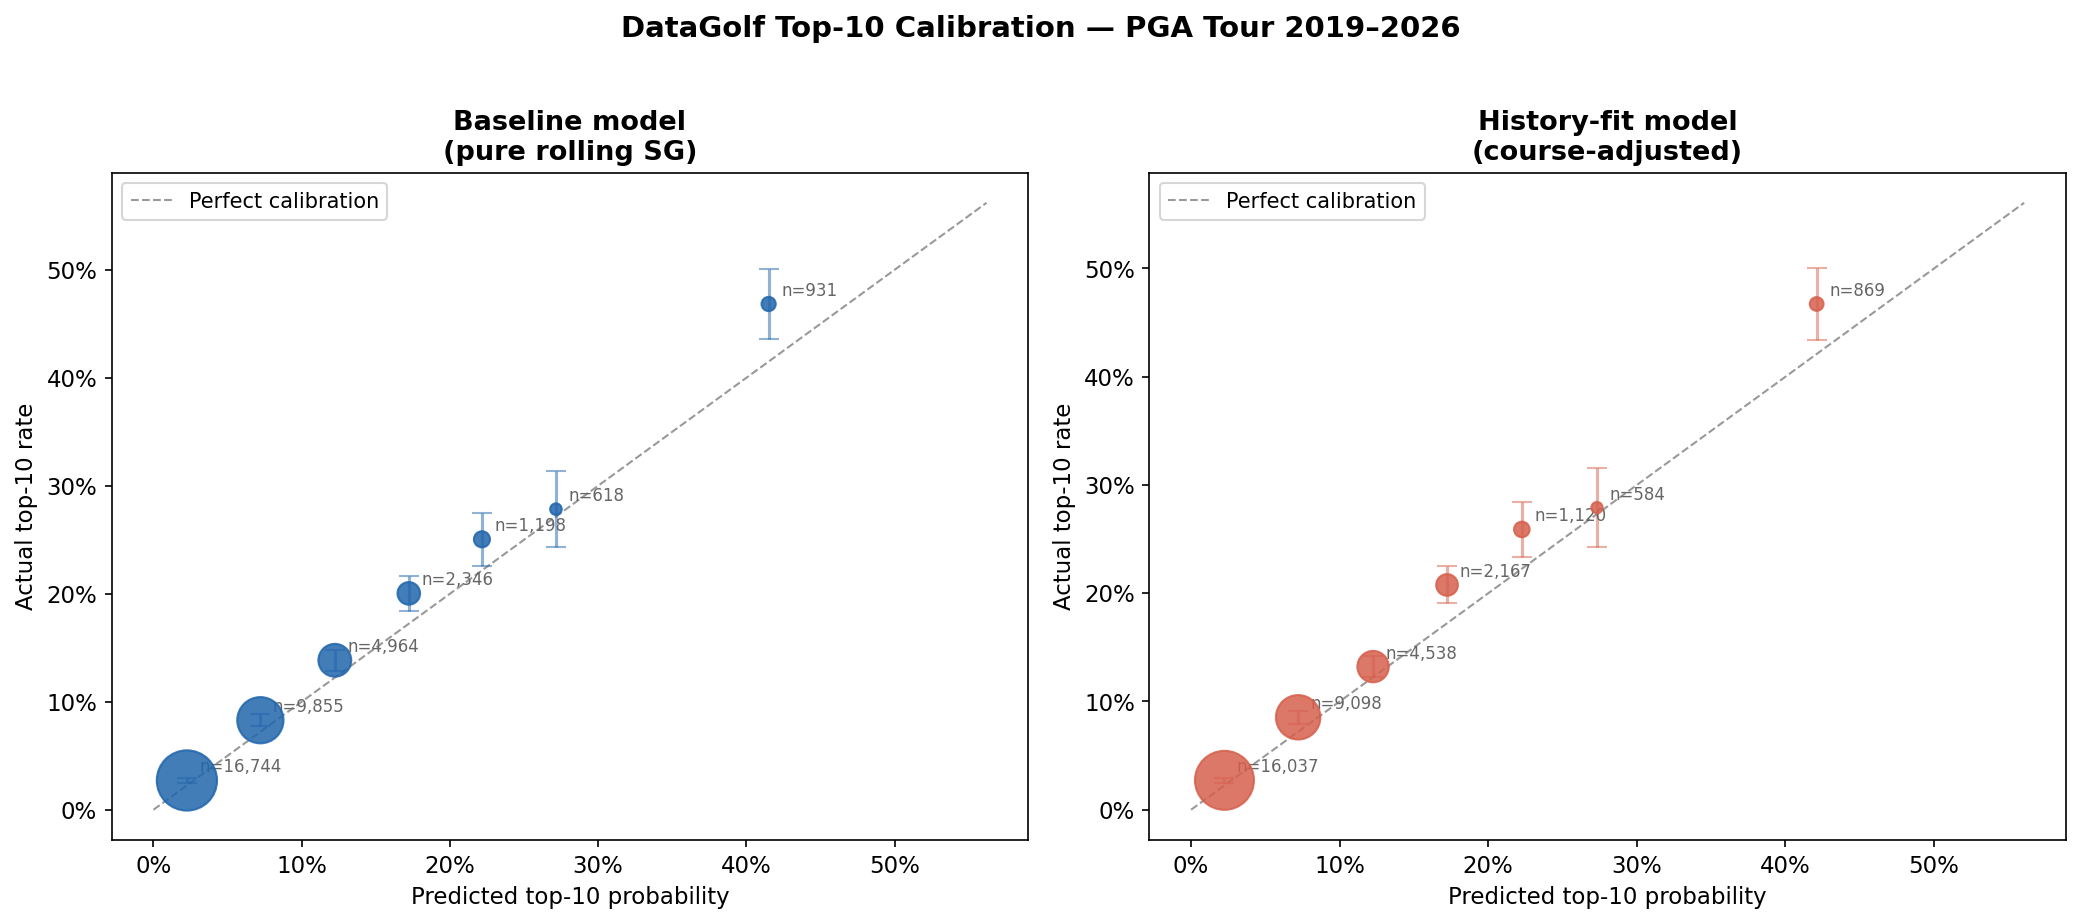
Finding 5 Course History Adds No Calibration Value
DataGolf offers two model variants: baseline (pure rolling strokes-gained) and baseline_history_fit (adds each player's historical performance at the specific course).
The calibration results are essentially identical: ECE of 1.1% vs. 1.2%. The direction of miscalibration is the same. The bin-level gaps are the same.
This does not mean course history is useless. Course history may help rank players correctly — putting the right players at the top of a leaderboard — even if it does not change how well-calibrated the probability estimates are. Ranking accuracy and calibration accuracy are different measures. But if you are building a model or making decisions that depend on the probability estimates, adding course history provides no improvement.
Caveats
Field size variation. The actual top-10 rate in this dataset is 9.1%, higher than the ~7.7% you would expect from a 130-player field (10 top-10 spots ÷ 130 players). This is because the dataset includes events with smaller fields — invitational events, Match Play, WGC events — where the per-player top-10 probability is structurally higher. These events also receive higher predicted probabilities per player, but not quite as high as reality warrants, which contributes to the observed underconfidence.
Selection bias in predictions. Players who receive high top-10 predictions may be selected into that pool partly because they are in unusually strong current form. If the model systematically underweights recent form, the high-prediction group would be in better shape than its baseline skill suggests — producing the observed outperformance. This is a hypothesis, not a confirmed mechanism.
This is aggregate calibration. The 1.1% ECE is an average. The model may be better calibrated in some conditions and worse in others — by course type, by field size, by player age or career stage, by season timing. Identifying those subgroup patterns is the natural next step.
Implications
The model is trustworthy as a starting point. An ECE of 1.1% is good enough to use DataGolf predictions as a foundation for analysis. The probabilities reflect real information about player skill.
Favor the favorites more than the model says. The systematic underconfidence means that if you take DataGolf probabilities at face value, you will underweight top-tier players. Applying a small upward adjustment — particularly for players in the 20%+ top-10 range — is supported by six years of data.
Don't use course history to improve probability estimates. The history-fit model produces identical calibration to the baseline. For purposes where probability accuracy matters, the simpler model is sufficient.
Track the post-2023 reversal. The Brier improvement through 2023 represented real progress; the 2024–2025 regression is large enough to investigate. If the cause is tour structure rather than model degradation, DataGolf may not be able to fix it without redesigning how it handles small-field and elevated events.
Data sourced from DataGolf Pro API. All analysis conducted in Python using pandas and scipy; code and methodology available in the Divot Lab research repository. Findings based on 292 PGA Tour events, 2020–2026. This study examines prediction model calibration and does not constitute gambling advice.