Background
Study 2 established that Pinnacle — the sharpest sportsbook in the world — has already absorbed whatever signal DataGolf's model carries. Their win-market estimates agree within 1 percentage point 95% of the time. If you're looking for an edge against Pinnacle's closing line, there isn't one in the win market.
But Pinnacle is not where most bettors place money. DraftKings, FanDuel, BetMGM, and similar consumer-facing books dominate the US market. These books are widely believed to operate differently: they cater to recreational bettors who wager on favorites and storylines rather than models, they shade their lines to balance the action they receive, and they apply significantly higher margins.
The natural question: if DataGolf has no edge against the sharpest book, does it have an edge against the softest ones? And if recreational books really do shade toward popular players — pricing Scheffler or McIlroy below their true probability to attract public money on the favorite — would DataGolf's signal, which has no exposure to betting flows, be the tool to find it?
This study tests both questions directly across eight major sportsbooks.
Data and Methodology
/preds/pre-tournament-archive · /historical-odds/outrights · Eight sportsbooks: DraftKings, FanDuel, BetMGM, Caesars, PointsBet, Bet365, Unibet, William Hill (of 11 candidates queried — BetRivers, Barstool, and a duplicate DraftKings identifier returned API errors)
Coverage: 56–65 of 66 unique tournaments per book · 24,000–35,500 joined player-event records per book per market · win and top-10 markets, opening and closing lines
Method — identical to Study 2, for direct comparability:
- Vig removal:
fair_prob = raw_prob / overround, where overround sums to the number of winners - Edge:
DataGolf probability − market fair probability - Disagreement-zone calibration: bin by edge, compare actual outcome rate to DataGolf's estimate and the market's
- Simulated ROI: flat-stake bets at closing odds where DataGolf is more bullish than the book, with bootstrap 95% confidence intervals (1,000 resamples)
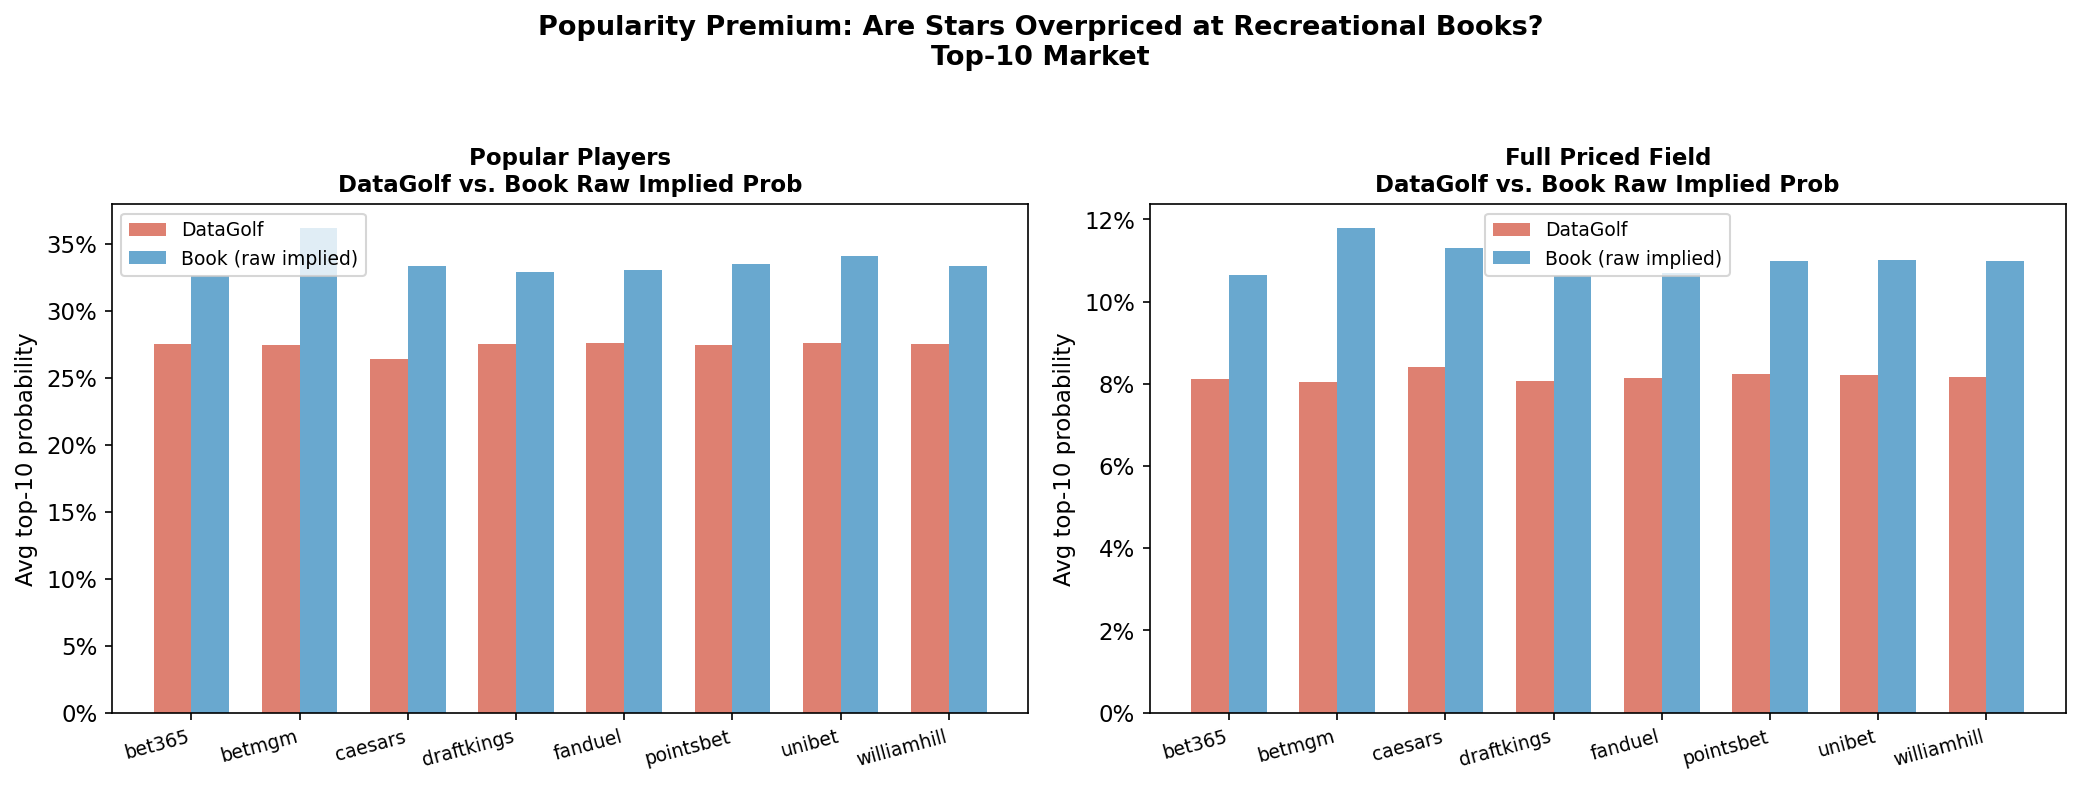
New for this study — the popularity premium test: Identify the 15 players DataGolf rates most consistently as elite (most frequent appearances with a 20%+ top-10 probability — Scheffler, Schauffele, Morikawa, McIlroy, Thomas, Cantlay, and others). For each book, compute the ratio of raw implied probability to DataGolf's probability for these players, and compare it to the same ratio for the full priced field. A higher ratio for popular players would indicate systematic overpricing — the signature of line-shading toward public favorites.
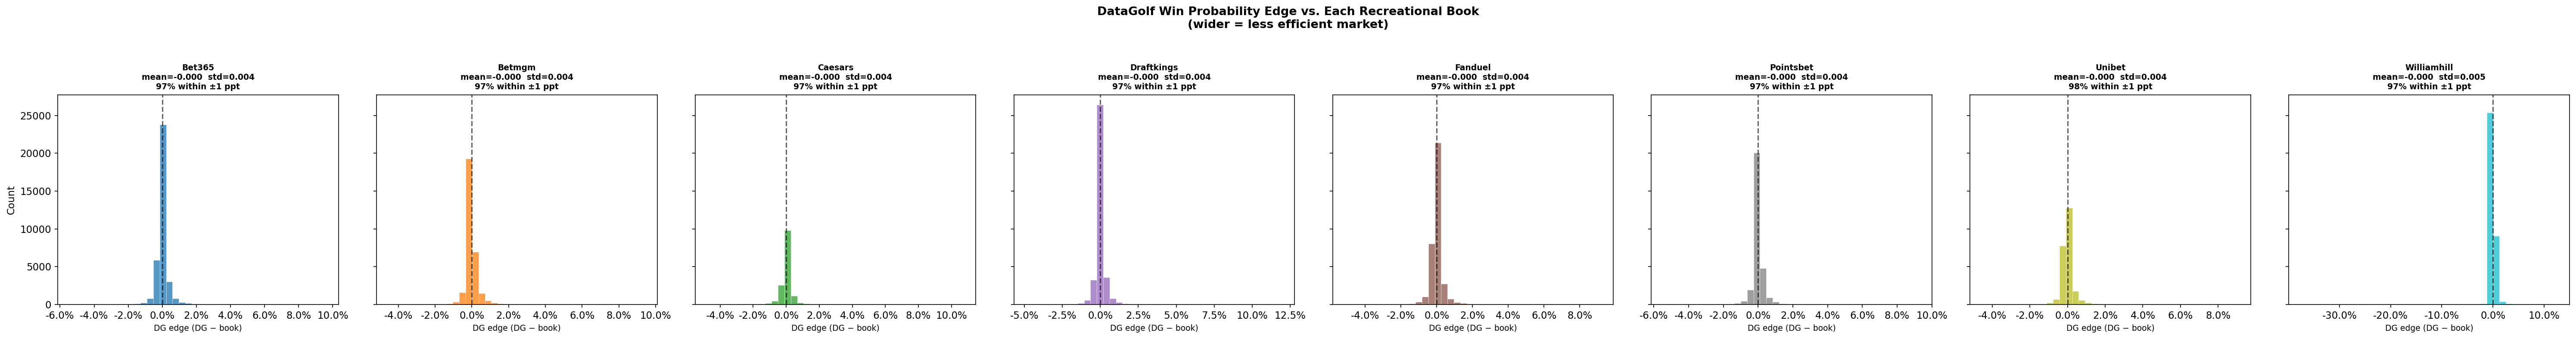
Finding 1 Every Book Converges on the Same Number — Once You Remove the Vig
The central surprise of this study: there is no meaningful difference in pricing accuracy between Pinnacle and any of the eight recreational books tested. Several actually agree with DataGolf more tightly than Pinnacle does.
Read the Full Study
Five findings, three charts, and the closing argument to a three-part series on where market edge in golf betting actually lives. Free with your email.
Joins the free Divot Lab newsletter. Unsubscribe anytime.
You're in — scrolling down now.
Finding 1 Every Book Converges on the Same Number — Once You Remove the Vig
The central surprise of this study: there is no meaningful difference in pricing accuracy between Pinnacle and any of the eight recreational books tested.
| Book | Std. dev. of edge vs. DataGolf | % agreement within ±1 ppt |
|---|---|---|
| Pinnacle (Study 2 reference) | 0.48 ppts | 95.0% |
| PointsBet | 0.40 ppts | 97.5% |
| Unibet | 0.42 ppts | 97.5% |
| DraftKings | 0.42 ppts | 97.1% |
| Bet365 | 0.43 ppts | 97.1% |
| Caesars | 0.43 ppts | 97.1% |
| BetMGM | 0.43 ppts | 97.3% |
| FanDuel | 0.43 ppts | 97.0% |
| William Hill | 0.51 ppts | 96.8% |
Highlighted rows agree with DataGolf more tightly than Pinnacle's reference figure from Study 2.
This rules out the most common assumption about recreational books: that they're running cruder, less informed pricing. They are not. Their fair-value lines are statistically indistinguishable from the sharpest book in the industry — and from a model built independently from skill data, not betting flows. The most likely explanation is that all of these books — sharp and recreational alike — are deriving their starting lines from a small number of shared wholesale or consensus sources, the same underlying signal DataGolf's strokes-gained model approximates from a completely different angle.
Finding 2 The Real Difference Is the Size of the Margin — Roughly Double
If the probabilities are the same, what makes a book "soft"? The answer is the price you pay to access that probability. We measured the actual win-market vig (the bookmaker's overround, expressed as a percentage above fair value) for each book on comparably sized fields (~85–89 priced players):
| Book | Win-market vig |
|---|---|
| Pinnacle | 23.4% (mean) / 21.2% (median) |
| PointsBet | 40.5% |
| Bet365 | 41.9% |
| FanDuel | 42.0% |
| DraftKings | 43.0% |
| BetMGM | 46.2% |
| Caesars | 49.3% |
| Unibet | 52.4% |
| William Hill | 53.1% |
vs. Pinnacle's margin
win-market vig
vig range
Recreational books charge 1.7× to 2.3× Pinnacle's margin for access to a number that, after adjustment, is the same number. This is the cleanest possible separation of two things that get conflated in casual conversation about "soft books": pricing accuracy and house edge. These books are not wrong. They are expensive.
A note on scale: 20–50% overround looks enormous next to the 2–5% margins quoted for two-way markets like point spreads, but multi-way outright markets with 80+ entrants are structurally different — minimum-price floors on dozens of longshots compound into large aggregate overrounds. Pinnacle's lower number reflects sharper competitive pressure on its pricing, not a fundamentally different approach to the market.
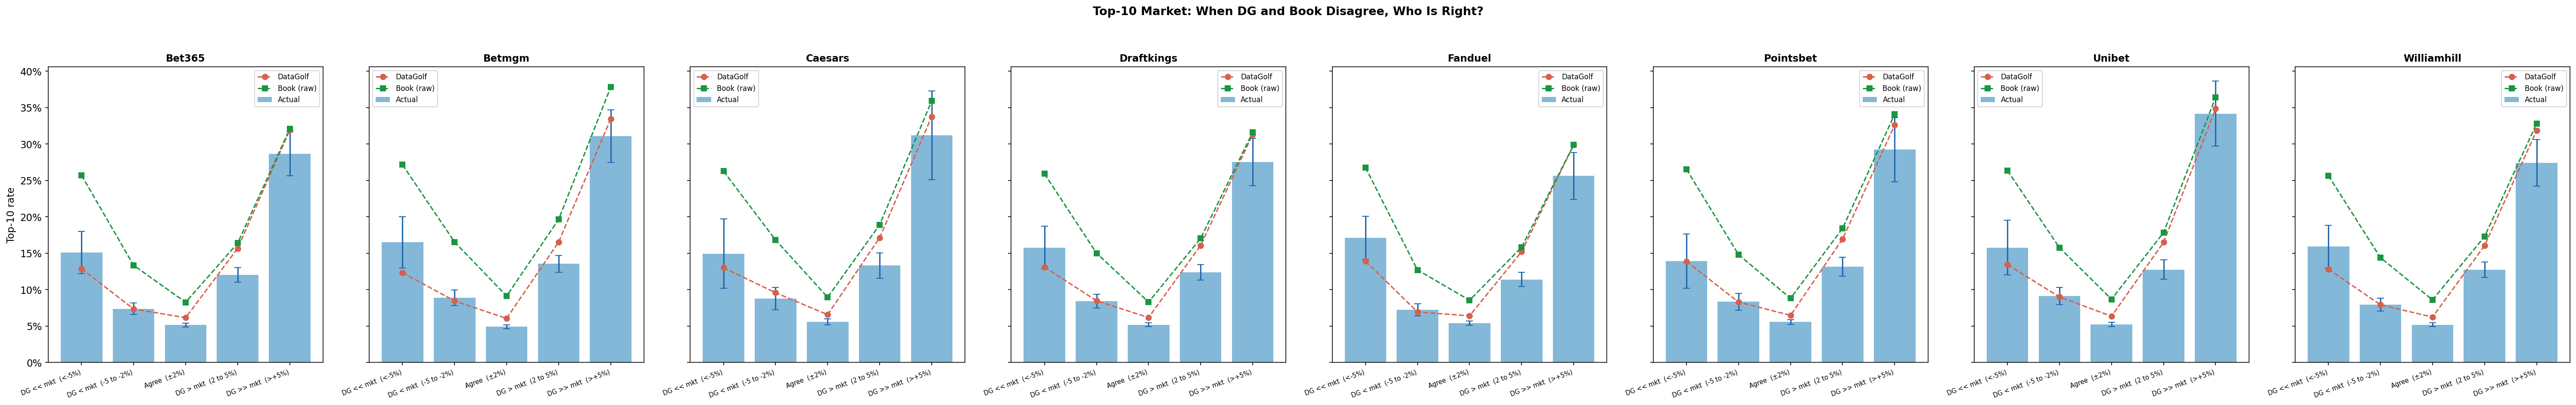
Finding 3 DataGolf Beats the Raw Line Everywhere — Because It's the Same Line
In the top-10 market, the calibration pattern Study 2 found against Pinnacle reproduces almost exactly at all eight recreational books:
| Disagreement zone | Actual rate | DataGolf | Raw book implied |
|---|---|---|---|
| DataGolf much more bearish (edge < −5%) | ~14–17% | ~12–14% | ~26% |
| Agreement (±2%) | ~5.0–5.6% | ~6.1–6.6% | ~8.3–9.1% |
| DataGolf much more bullish (edge > +5%) | ~26–34% | ~30–35% | ~30–38% |
At every single book, in every disagreement zone, DataGolf's probability sits closer to the actual outcome than the book's raw implied probability — with the largest gap (10+ percentage points) occurring exactly where Study 2 found it largest against Pinnacle: when DataGolf is substantially more bearish than the market. The raw market — at any of these eight books — systematically overprices top-10 finishes. DataGolf does not.
This is not eight new findings. It is one finding, replicated eight times, because the underlying number being compared against is the same number every time. DataGolf's calibration advantage over "the market" is a property of the relationship between DataGolf and the shared consensus signal — not a property of any individual bookmaker's idiosyncrasies.
Finding 4 A Bigger Gap Against a Worse Price Still Loses — Because You Pay the Price, Not the Gap
Simulated ROI remains significantly negative across every book and every threshold tested:
| Market | Edge threshold | Pinnacle (Study 2) | Recreational books (range) |
|---|---|---|---|
| Win | edge > 0% | −40.4% | −28.6% to −44.3% |
| Top-10 | edge > 0% | −35.2% | −33.9% to −41.5% |
| Top-10 | edge > 5% | −2.7% (not significant) | −11.8% to −22.7% (sig. at 6 of 8) |
The last row is the most revealing comparison in the study. Against Pinnacle, DataGolf's largest top-10 disagreements (edge > 5%, n=73) produced a simulated ROI statistically indistinguishable from zero — the small sample couldn't rule out a real edge. Against every recreational book, that same test — now with samples 5–11× larger — comes back significantly negative.
The arithmetic is simple but easy to miss: DataGolf's gap against the raw recreational-book line is larger than its gap against Pinnacle's raw line (because recreational books' raw lines are further from fair value, being padded with more vig). But a bettor pays the bookmaker's actual closing price, not the fair price. A bigger calibration gap against a more padded line does not produce a better bet — it produces the same bet at a worse price. The vig is not a constant that subtracts evenly from every edge; it is the very thing that determines whether a real calibration advantage survives contact with a real wager.
Finding 5 The Popularity Premium Doesn't Exist — If Anything, It Runs Backwards
This is the most counterintuitive result in the study, and the one that most directly overturns the working hypothesis.
We compared the ratio of each book's raw implied top-10 probability to DataGolf's probability — first across the full priced field, then restricted to the 15 players DataGolf rates most consistently as elite (Scheffler, Schauffele, Morikawa, McIlroy, Thomas, Cantlay, Im, Matsuyama, Hovland, Rahm, and others — 48 to 130 event-appearances each at a 20%+ top-10 rating):
| Book | Full-field ratio | Popular-player ratio | Gap |
|---|---|---|---|
| BetMGM | 1.46 | 1.32 | −14.7 ppts |
| William Hill | 1.35 | 1.21 | −13.5 ppts |
| Bet365 | 1.31 | 1.18 | −12.7 ppts |
| DraftKings | 1.32 | 1.19 | −12.2 ppts |
| FanDuel | 1.31 | 1.20 | −11.2 ppts |
| PointsBet | 1.33 | 1.22 | −11.1 ppts |
| Unibet | 1.34 | 1.24 | −10.4 ppts |
| Caesars | 1.35 | 1.26 | −8.2 ppts |
Ratio = book's raw implied probability ÷ DataGolf's probability. A ratio above 1.0 means the book prices the player higher (more vig-padded) than DataGolf does.
If recreational books shaded their lines toward popular favorites — pricing Scheffler shorter than his true probability to attract public money — the popular-player ratio would sit above the field ratio. It sits below it, at every book, by 8 to 15 percentage points.
The likely mechanism is the inverse of the original hypothesis. Star players are exactly where sharp bettors and line-shoppers concentrate their attention and their dollars — these are the lines that get compared across books, picked apart by models, and bet hardest by the most price-sensitive customers. Bookmakers compress margins where competitive pressure is highest. The mid-tier and longshot portions of the field — where the action is thinner, the bettors are softer, and the lines are rarely shopped — are where the larger markups actually live. The "soft spot" exists. It's just not where casual intuition places it.
Caveats
Eleven candidate books, eight usable. BetRivers, Barstool, and a "draftkings_sportsbook" identifier returned 400 errors from the API and were excluded. This is not believed to materially bias the results — the eight books that returned data span a wide range of US and international operators.
The "popular player" definition is a DataGolf-internal proxy, not a direct measure of betting handle, search interest, or media attention. It identifies players the model rates as elite and consistent — a reasonable but imperfect stand-in for "the players the public bets on." A book's own handle-by-player data, which is not exposed by this API, would be a sharper instrument for this specific test.
Coverage varies by book. Caesars (56–57 events) and Unibet (58 events) have noticeably thinner coverage than the four books with 65-event coverage (DraftKings, FanDuel, Bet365, William Hill). Caesars' popularity-premium sample (n=791) is roughly half the size of the largest books' — its result should be weighted accordingly.
The top-10 vig-normalization issue from Study 2 persists here, and we handle it the same way: Finding 3 uses raw implied probability rather than vig-adjusted probability for the cross-book disagreement comparison, since normalizing a partially priced field to exactly 10 winners inflates adjusted probabilities for small-field events.
Win-market overround scale. A reader unfamiliar with multi-way outright markets may see "40–53% vig" and assume something predatory. It isn't unusual for an 85-player field — the comparison that matters is the relative one (roughly double Pinnacle's), not the absolute number.
Implications
"Shop for a soft book" is not a useful strategy if your goal is better information — it's a useful strategy if your goal is a worse price on the same information. Every book in this study is pricing off essentially the same signal DataGolf approximates. None of them is giving away free information. The only thing that varies across books is how much they charge to access the consensus number.
If a calibration edge exists, it lives at the sharpest book, not the softest. This sounds backwards until you trace the logic: the gap between DataGolf and a book's raw line is wider at recreational books (because their lines carry more vig-driven distortion), but the price you actually pay is also further from fair value by the same amount. Pinnacle's tighter margin means a real edge has the best — and really the only plausible — chance of surviving the vig. Study 2 found that chance statistically inconclusive at n=73. This study suggests it does not improve by looking elsewhere.
The popularity-premium intuition — a staple of casual betting commentary — does not survive contact with the data, at least not in the direction commonly assumed. If there is a "public money" effect on golf board pricing, this analysis suggests it suppresses margins on stars rather than inflating their prices, the opposite of the intuitive story. This is worth treating as a standalone finding in its own right, independent of anything to do with DataGolf.
Data sourced from the DataGolf Pro API and eight sportsbooks' historical odds (DraftKings, FanDuel, BetMGM, Caesars, PointsBet, Bet365, Unibet, William Hill). All analysis conducted in Python using pandas and scipy; methodology available in the Divot Lab research repository. Findings based on 56–65 PGA Tour events per book, 2020–2026. This study examines model and market pricing and does not constitute gambling advice.