Background
Study 01 established that DataGolf's model is well-calibrated overall — an Expected Calibration Error of 1.1% is a strong result. But calibration measures a model against reality. A different question is how the model compares against the best available alternative: the betting market.
Sportsbooks aggregate the information of every sharp bettor in the world, corrected in real time. If DataGolf's model is better than the market, bettors using it would have a systematic advantage. If it is not, the market has already priced whatever DataGolf knows.
This study tests that directly. We join DataGolf's pre-tournament probability estimates against Pinnacle's opening and closing lines across 284 events from 2019–2026, covering both the win and top-10 markets.
Why Pinnacle? Pinnacle is the industry benchmark for market efficiency research. It carries the lowest vig of any major book (approximately 4–5% margin), accepts large wagers from sharp bettors, and closes at the most efficient price available. Comparing DataGolf against Pinnacle's closing line sets the hardest possible bar.
Data and Methodology
/preds/pre-tournament-archive · /historical-odds/outrights · Pinnacle sportsbook · 288 events with Pinnacle odds (8 API errors), 2019–2026
Win market: 284 event-years · 24,100 player-event records · ~85 players priced per event
Top-10 market: 75 event-years · 5,242 records · ~70 players priced per event
Vig adjustment: Raw implied probability from decimal odds is 1 / odds. To remove the bookmaker's margin, we normalize: fair_prob = raw_prob / overround, where overround sums to the number of winners (1 for win, 10 for top-10). This converts market prices to probability estimates comparable to DataGolf's output.
Edge: DataGolf probability − market fair probability. Positive edge means DataGolf is more bullish than the market on that player.
Simulated ROI: Treats each player with positive DataGolf edge as a flat-stake bet at closing odds. P&L = (closing_odds − 1) if the outcome is achieved, −1 otherwise. Bootstrap 95% confidence intervals from 1,000 resamples.
One methodological note: The top-10 vig normalization introduces a confound for small-field events (Sentry, WGC Match Play, some invitationals). When only 70 players are priced in a 30-player field, normalizing to 10 winners inflates individual adjusted probabilities. For the top-10 market, raw implied probability is the more honest comparison in disagreement cases. Both figures are reported below.
Finding 1 The Win Market Has Already Absorbed DataGolf's Signal
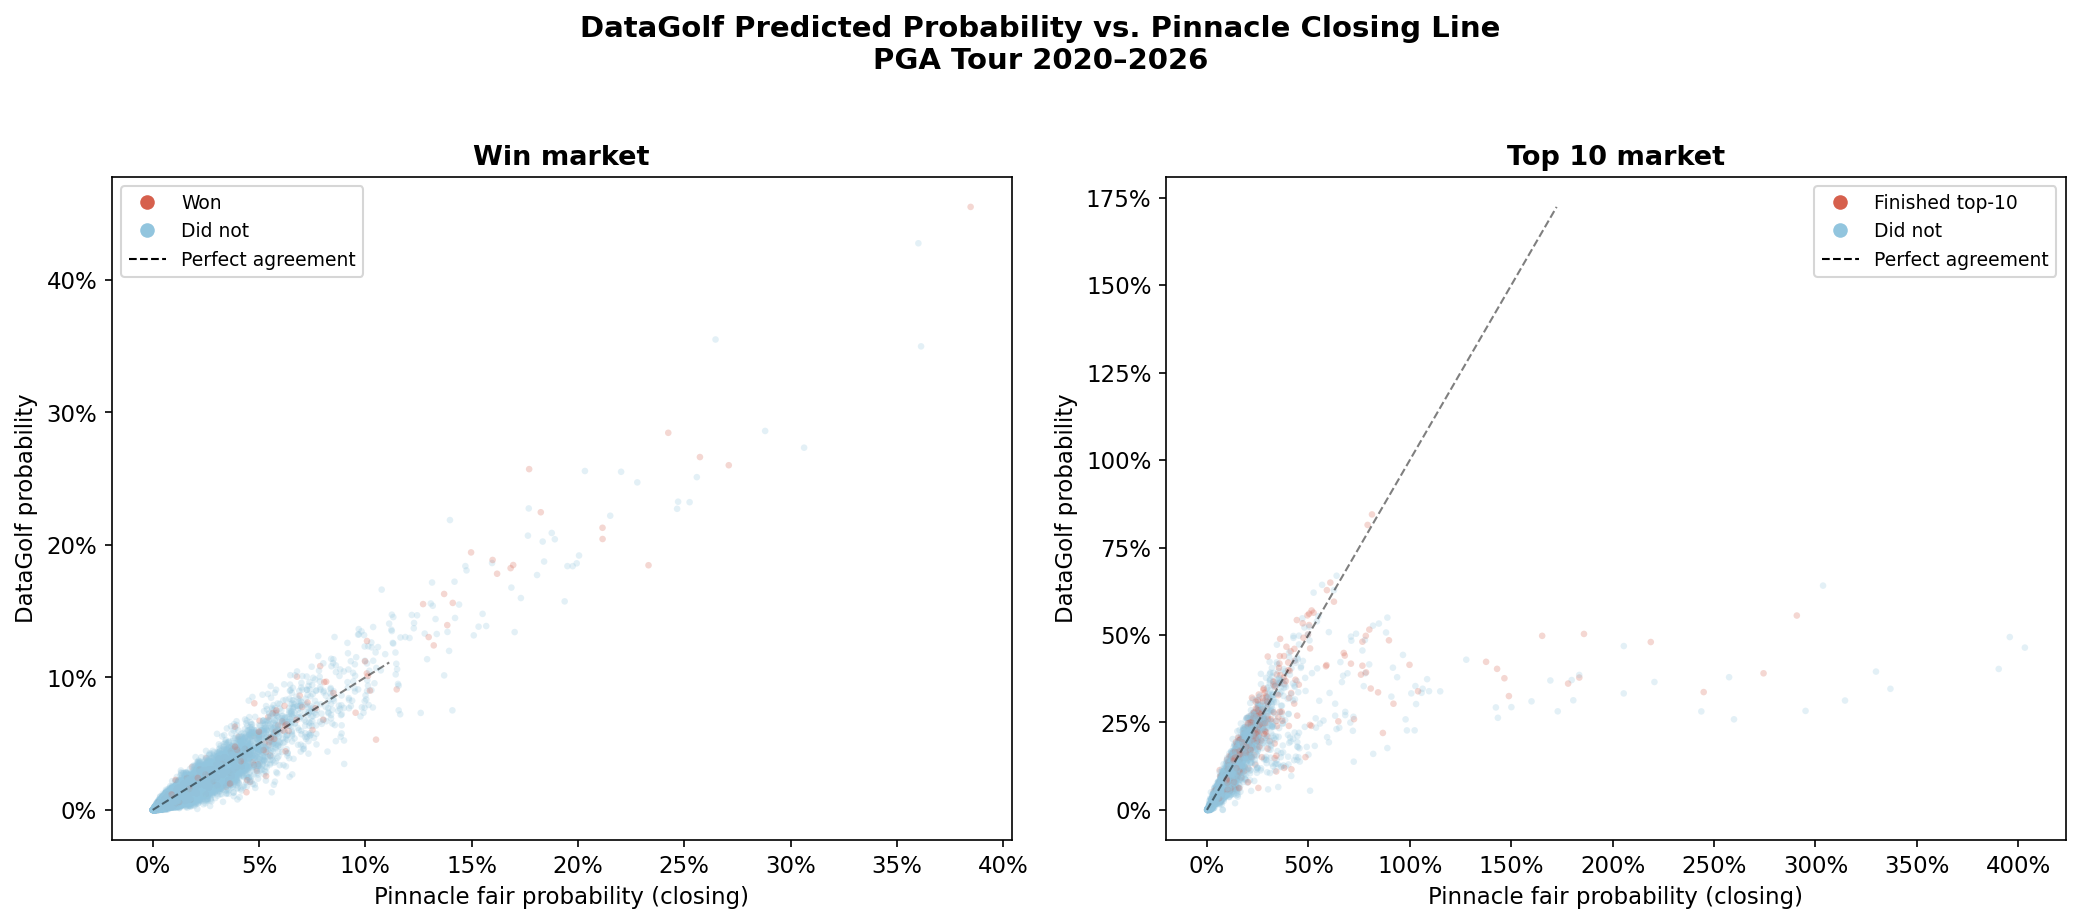
The distribution of DataGolf edge against Pinnacle's win closing line has mean −0.06 percentage points and standard deviation 0.48 ppts. Ninety-five percent of all observations fall within 1 percentage point of each other.
These are not two independent models arriving at similar answers. They are converging on the same answer.
Read the Full Study
Four findings, three charts, and the ROI math that explains why being right isn't enough. Free with your email.
Joins the free Divot Lab newsletter. Unsubscribe anytime.
You're in — scrolling down now.
Finding 1 The Win Market Has Already Absorbed DataGolf's Signal
win closing line (ppts)
±1 ppt of each other
win market bets
The distribution of DataGolf edge against Pinnacle's win closing line has a mean of −0.06 percentage points and a standard deviation of 0.48 ppts. Ninety-five percent of all observations fall within 1 percentage point of each other.
These are not two independent models arriving at similar answers. They are converging on the same answer. The win market is so efficiently priced with respect to DataGolf's underlying information that the two sources are functionally interchangeable.
When they do disagree at the +2 to +5% level (n=103): DataGolf predicts 11.2%, the market implies 8.4%, and the actual win rate is 10.7%. DataGolf is marginally more accurate. But with 103 observations, this falls within normal sampling variation and cannot support a statistical conclusion.
The −40.4% simulated ROI for bets placed on any positive DataGolf edge over the win market (95% CI: −55.7% to −23.2%) is a direct consequence of this near-zero mean edge. DataGolf's slightly-higher-than-market win estimates are noise around zero, not signal. Betting on small noise gets crushed by vig. This is not evidence that DataGolf is wrong — it is evidence that the win market is efficient with respect to DataGolf's model.
Finding 2 The Top-10 Market Is Different — DataGolf Wins the Disagreements
The top-10 market is less liquid. Only 75 of 284 event-years have Pinnacle top-10 odds. Fewer sharp bettors are trading it. The result: a market that does not fully incorporate DataGolf's signal.
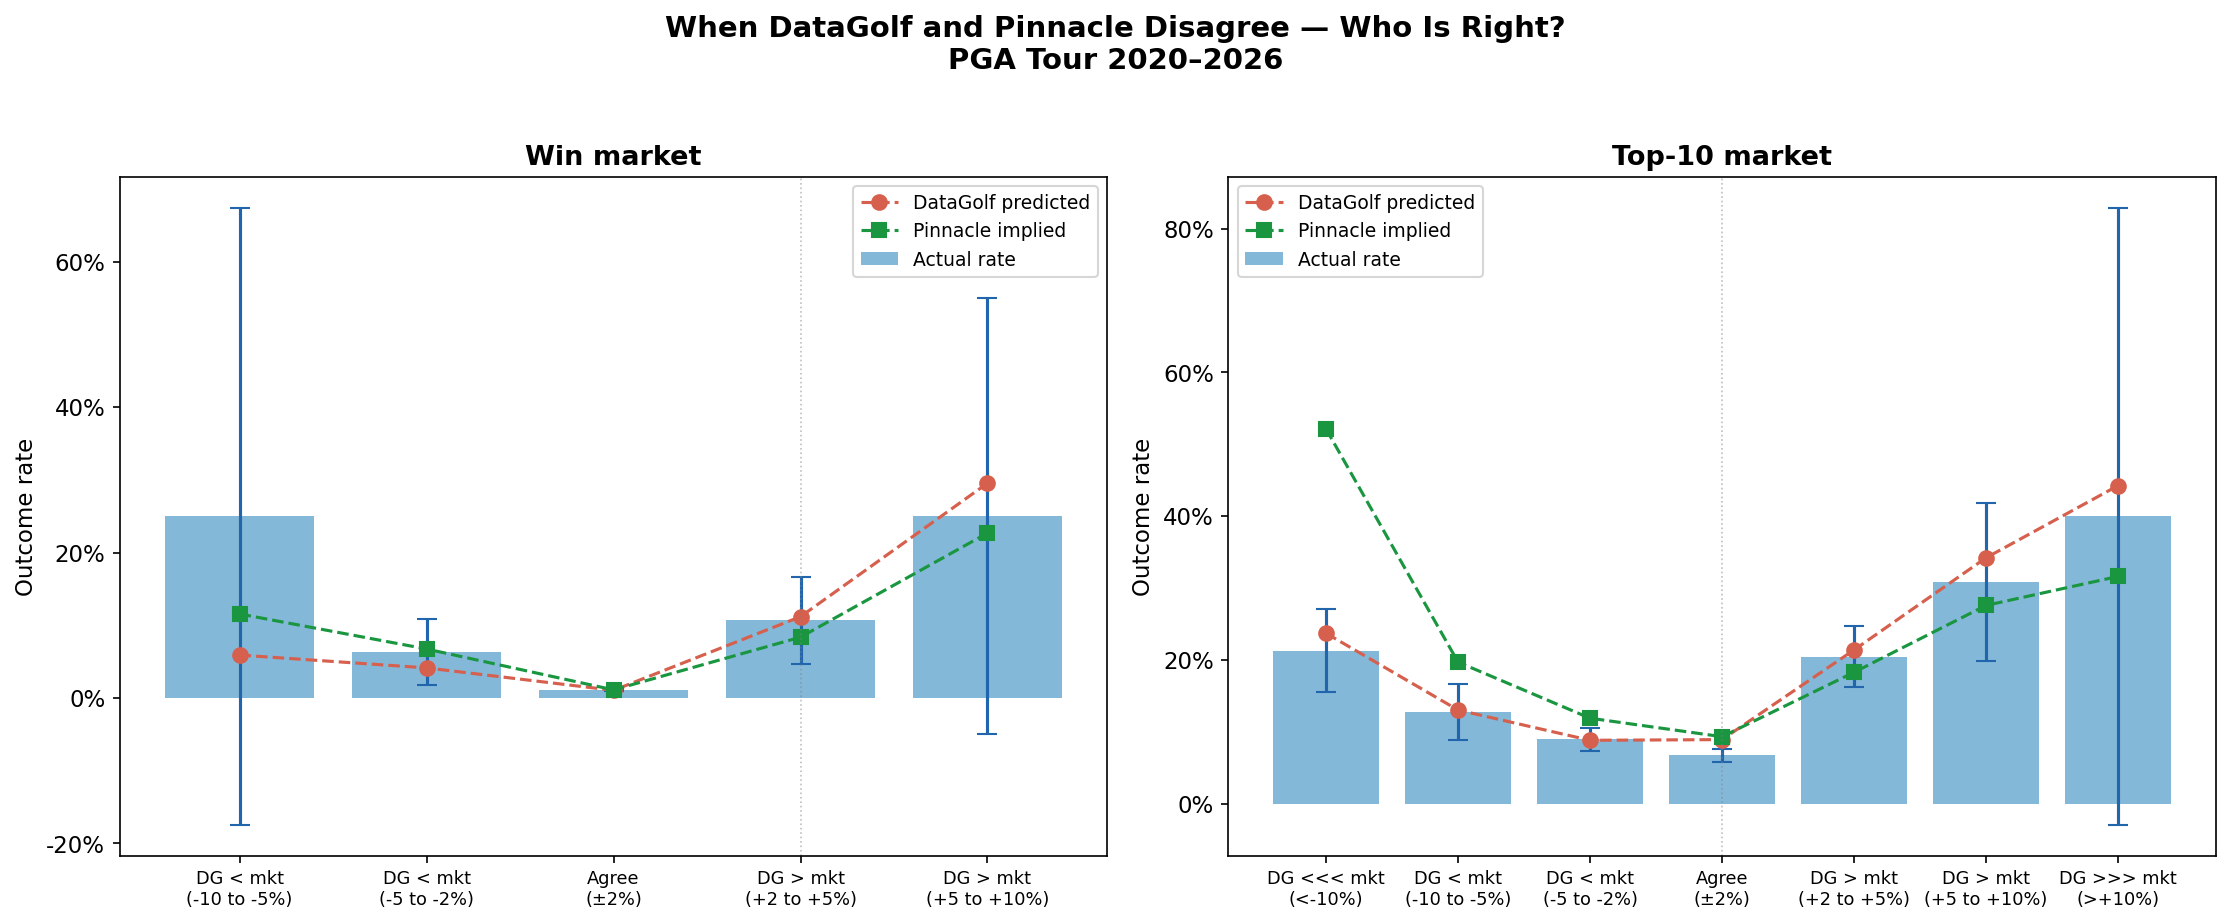
When DataGolf and Pinnacle disagree on top-10 probability, DataGolf is consistently closer to actual outcomes — in both directions:
| Situation | DataGolf | Market (raw implied) | Actual | Closer |
|---|---|---|---|---|
| DG bullish (n=415, +2%+) | 23.8% | 25.6% | 22.4% | DataGolf |
| Agreement (n=3,105, ±2%) | 8.9% | ~9.3% | 6.7% | Tied |
| DG bearish (n=502, <−5%) | 18.8% | 27.4% | 17.3% | DataGolf |
The "DG bearish" group deserves particular attention. The market assigns a 27.4% raw implied top-10 probability to these players; they actually finish top-10 at 17.3%. DataGolf says 18.8% — essentially correct. The market is overestimating by 10 percentage points. These observations are concentrated in small-field events (Sentry, WGC, Match Play) where per-player top-10 probability is structurally higher, and the market appears to overcorrect for field size relative to what the data supports.
Finding 3 Being Right Is Not Enough — The Vig Absorbs the Edge
Simulated ROI for top-10 bets where DataGolf has any positive edge: −35.2% (significantly negative). DataGolf is more accurate in disagreement bins. How can ROI still be deeply negative?
The answer is vig.
ROI is calculated against closing odds, not fair probabilities. If Pinnacle offers a top-10 market at 4.0x (raw implied 25%) and the fair probability is 22%, the expected return is: 22% × 3 + 78% × (−1) = −12%. Being right by 3 percentage points does not help when the book's margin requires you to beat the closing line by more than 5–10 points to profit.
DataGolf's top-10 calibration advantage is real — but not large enough to overcome the vig at flat stakes. It means the model is better. It does not mean the model is better enough to extract profit at Pinnacle's sharpest prices.
The top-10 edge >5% bucket (n=73) tells a more ambiguous story: ROI of −2.7% with a 95% confidence interval of [−41.5%, +46.8%]. With 73 observations, this is indistinguishable from zero. A sample of 500–700 events with top-10 odds could resolve whether DataGolf's largest disagreements produce genuine positive expected value. The current data cannot answer that question.
Finding 4 The Market Partially Corrects Toward DataGolf During the Week
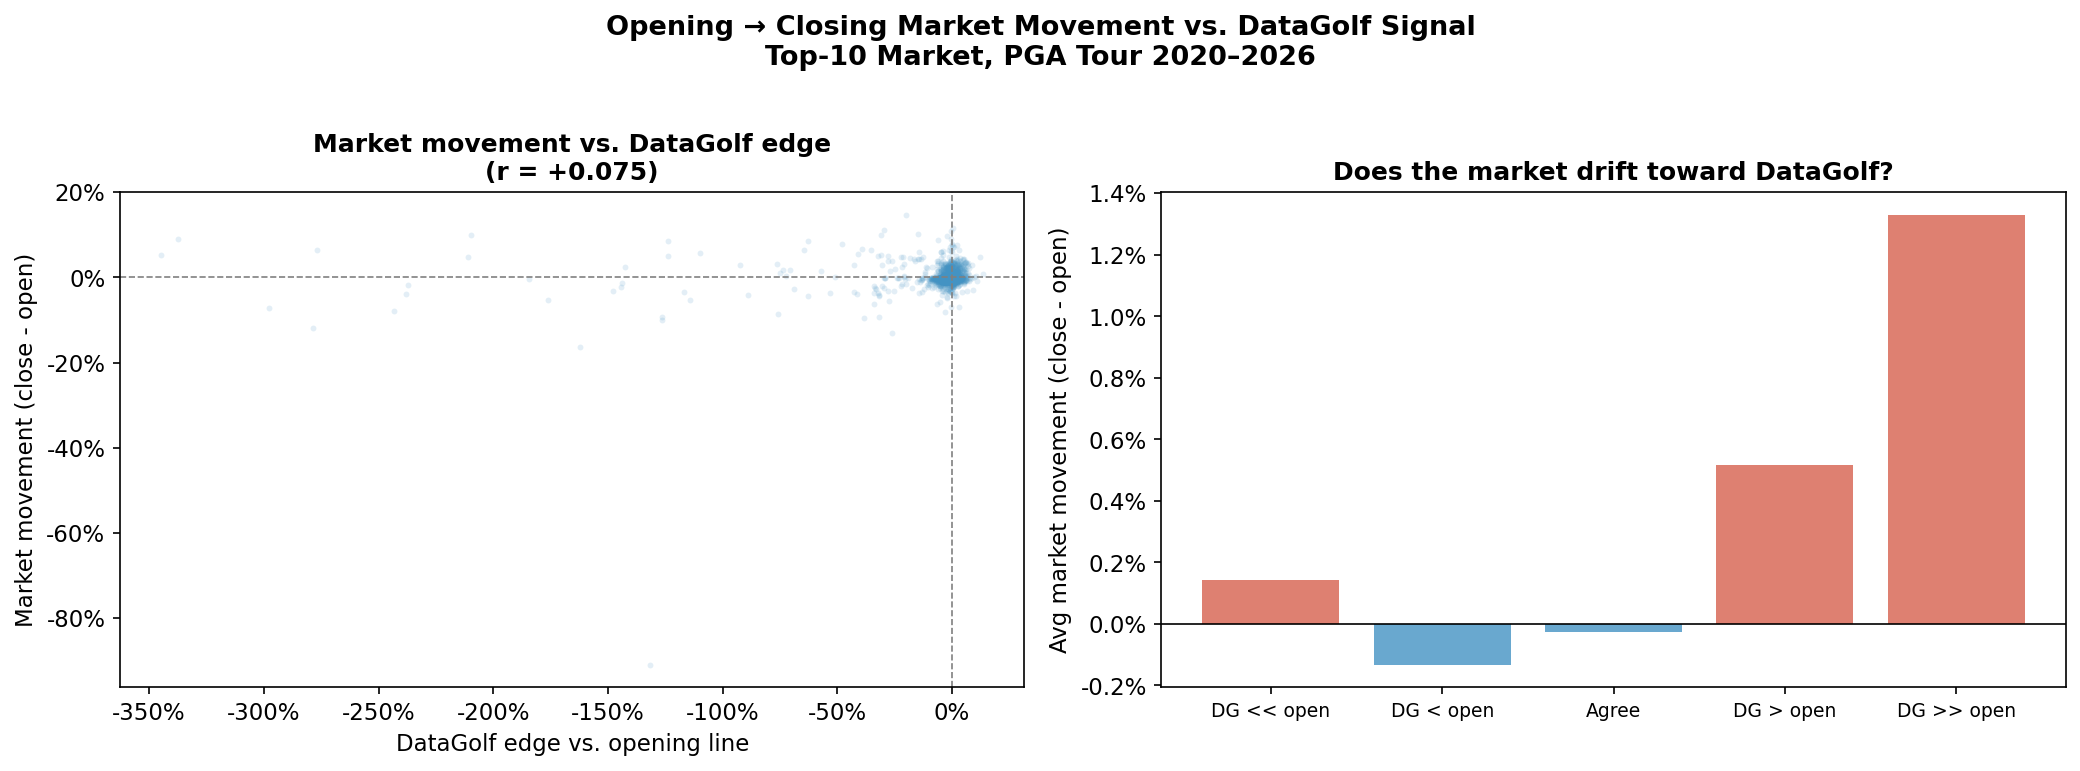
Correlation between DataGolf edge vs. opening odds and market movement from open to close: r = +0.075. The direction is consistent and interpretable:
| DataGolf position vs. opening line | Avg. market movement, open → close |
|---|---|
| DG much more bullish (>+5%) | +1.33 ppts toward DataGolf |
| DG slightly more bullish (+2–5%) | +0.52 ppts toward DataGolf |
| Agreement (±2%) | −0.03 ppts (flat) |
| DG more bearish (<−2%) | −0.13 ppts (slight reverse) |
When DataGolf is substantially more bullish than the opening line, the market drifts approximately 1.3 percentage points in DataGolf's direction by Thursday. This is a weak but directionally consistent signal: some of DataGolf's information — or the same information DataGolf uses — flows into closing prices during the week.
The practical implication: the opening line is less efficient than the closing line. If DataGolf has any exploitable signal against the market, it would appear at the opening line, not the close. By Thursday, much of it has been corrected.
Caveats
Win market sample concentration. Ninety-five percent of win market observations fall within the ±1% agreement band. The edge buckets (n=4 to n=111 per bin) have too few observations to support statistical conclusions about divergence cases.
Top-10 vig normalization for small-field events. Normalizing the top-10 market to sum to exactly 10 winners across the priced subset inflates adjusted probabilities when a 30-player field has 70 players priced. The raw implied probability column is the more reliable comparison in the DG-bearish bucket, where this artifact is largest.
Coverage asymmetry. Pinnacle prices win odds for virtually every PGA Tour event; it prices top-10 odds for approximately 26% of events. The top-10 findings rest on a smaller, potentially non-representative sample that skews toward higher-profile events.
Correlation is not causation. The market movement finding (r=+0.075) shows alignment, not that DataGolf causes the movement. Both may reflect the same underlying information becoming publicly available during the week.
This is Pinnacle only. Pinnacle represents the sharpest available market. Recreational sportsbooks — DraftKings, FanDuel, Caesars — operate with higher margins and different pricing incentives. They are not tested here.
Implications
The win market has priced DataGolf. If you are using DataGolf win probabilities to find betting value against any major sportsbook, the information is already in the price at the sharpest books. The signal is real; the edge has been arbitraged away.
The top-10 market is where the question is still open. DataGolf's estimates are more accurate than Pinnacle's implied odds in disagreement cases. Whether that translates to positive expected value at closing odds requires more data than 75 events can provide. The direction is promising; the confidence is not there.
Bet opening lines, not closing. If any edge exists, it is largest at the opening line and shrinks through the week as the market corrects. The correlation between DataGolf edge and market movement confirms this directionally.
The interesting comparison is against recreational books. Pinnacle is the hardest benchmark. DraftKings, FanDuel, and Caesars shade their lines to balance recreational action rather than to set efficient prices. If DataGolf's edge is zero against Pinnacle's closing line, it may still be meaningful against a book that systematically overprices popular players. That is Study 3.
Data sourced from DataGolf Pro API and Pinnacle sportsbook historical odds. All analysis conducted in Python using pandas and scipy; code and methodology available in the Divot Lab research repository. Findings based on 284 PGA Tour events (win market) and 75 events (top-10 market), 2019–2026. This study examines model and market accuracy and does not constitute gambling advice.